How has air quality varied across India’s cities and towns over the last decade?
Reading this carefully
- Shows
- Most of India’s monitored locations have had annual PM10 above the national standard throughout 2015–2024: 323 of 433 mapped locations in 2024, and 130 of the 247 locations with at least 8 years of data in every single year. The problem is not confined to the northern plains; West Bengal, Maharashtra and Odisha also have many always-over locations. Last winter, the worst weeks were concentrated in the Delhi region from November into January.
- Doesn’t show
- Whether air quality has improved. Median PM10 across the 206 long-monitored locations fell about 13% from 2015 to 2024, but CPCB changed how location values are calculated in 2021 and the network grew sharply, so the two can’t be separated. It also doesn’t describe the air between monitored locations, or whole states, and the six weeks of this winter are too short to call a change.
- Connected to
- Weather, especially the winter inversion over the northern plains; crop-residue burning; industry and mining in Jharkhand and Odisha; road and construction dust; where stations are sited (kerbside, industrial or background); and the growth of the monitoring network itself. None of these were tested in this work.
Most of India’s monitored locations have recorded annual PM10 above the national standard throughout the last decade, and the median PM10 across them (the middle value: half the locations above it, half below) is only modestly lower, by an amount that can’t be separated from a 2021 change in method. In 2024, 323 of the 433 mapped locations had annual PM10 above 60 µg/m³, and of the 247 locations with data in at least 8 of the 10 years, 130 exceeded the standard in every single year.
The work began as an attempt at a simple state-wise air quality map and turned into something a bit different. This piece covers why the analysis maps monitored locations rather than states, how CPCB’s annual tables were brought into a usable shape, what the decade looks like, how states can be compared without overstating what the data says, and what last winter looked like week by week. It is an exploratory look, not research, and the text tries to say clearly where the data stops supporting a conclusion.
Why monitored locations and not states
The first plan was a state-wise map of India with a weekly AQI value for each state, animated through a year. A look at the locations of the monitoring stations showed why that wouldn’t hold up. Nearly all ambient air quality monitoring stations are located in urban areas, mostly in cities and larger towns, so a state value would really be the value of a handful of monitored cities and towns, extended over large areas of farmland, forest and smaller towns where no measurements are taken. A state like Uttar Pradesh would take the colour of Ghaziabad, Noida and Lucknow, even though the western and eastern ends of the state experience quite different conditions.
The maps therefore show the monitored locations instead. Each point is a place where measurements were actually taken, and the space between them is left empty, because that is what the data can support. The cost is that the regional picture, for example the northern plains behaving as one airshed in winter, has to be read from the pattern of points rather than from a filled map. States return later in the piece, but only in a form that rates the monitored locations of a state, and only where those locations cover enough of the state to say something.
The data
The decade view uses the Central Pollution Control Board’s annual tables from the National Air Quality Monitoring Programme, one PDF per year from 2015 to 2024. They give annual averages of SO₂, NO₂, PM10 and PM2.5 (and from 2024 also NH₃ and benzene), but they are not consistent across the decade. From 2015 to 2020 the tables list individual manual monitoring stations, with the number of monitoring days and the 24-hour minimum and maximum for each. From 2021 onwards they list one integrated value per location, combining manual and continuous stations, with no station detail. PM2.5 is also thin in the early years: in 2015 only a handful of states reported it at all.
These are annual averages, so they can’t give weekly or seasonal patterns, and they can’t be turned into an AQI either, because India’s AQI is defined on 24-hour and 8-hour concentrations. For that reason the decade maps show each location’s annual average as a multiple of the national annual standard (60 µg/m³ for PM10 and 40 µg/m³ for PM2.5) rather than as an AQI.
For the recent winters, daily PM2.5 was taken from CPCB’s Continuous Ambient Air Quality Monitoring Stations (CAAQMS), downloaded through the OpenAQ API because CPCB’s own dashboard couldn’t be accessed for bulk download at the time. That covers 1 October 2025 to 28 February 2026 and 1 October to 11 November 2026. No 2025 annual table from CPCB could be found at the time of writing, so 2025 appears only through these winter weeks.
Getting the tables into usable shape
Most of the effort went into this step. Copying text out of the PDFs ran numbers together (Vapi’s 2022 row came out as “379 119 69” when the cells were 37, 9, 119 and 69), and page numbers attached themselves to the last value on a page. The tables were therefore extracted cell by cell rather than as text, which resolved every fused number found. Seven 2022 rows split across page breaks were matched back to their locations manually and checked against the text.
The 2015 to 2020 station tables had a different problem. State and place names occupy merged cells, vertically centred across several station rows, so simply copying a label down to the rows below placed stations in the wrong location (Ankleshwar’s stations would have ended up under Ahmedabad). Each station was instead assigned to its location and state using the geometry of the table cells, giving 12,903 station-pollutant rows. Every row was checked that its annual mean lies between its own minimum and maximum. Nine rows failed, mostly 2019 rows for Ghaziabad, Hapur and Noida where several stations share one cell, and these were excluded rather than corrected by guesswork. Another 42 rows report monitoring days, minimum and maximum but no annual mean, and those were left blank.
Place names were the next issue. The same place is spelled differently from year to year (Gurgaon and Gurugram, Bareily and Bareilly, three spellings of Byrnihat), and some names were split across lines inside a cell. After harmonisation there are 545 distinct monitored locations. A location here is whatever CPCB lists as a separate place in its tables, which it labels as city, town or village; most are cities and towns, but some are parts of larger urban areas (Jharia, Sindri and Jorapokhar, for example, all lie within Dhanbad Municipal Corporation), some are industrial areas such as Byrnihat, and a few in Punjab are village monitoring sites. The station tables also had 579 rows assigned to the wrong state, for example West Bengal towns tagged as Uttarakhand, and these were corrected using each location’s state in the 2021 to 2024 tables. For 2015 to 2020 a location’s value is the mean of its stations; from 2021 it is CPCB’s own integrated value for that location.
Finally, the locations needed coordinates. These were taken, in order of preference, from the median position of a location’s CPCB stations on OpenAQ, a GeoNames-derived place list, Natural Earth places, and as a last resort a district centroid, always matching within the same state. Fuzzy name matches were checked manually and the wrong ones discarded (Amlai had matched Amla, Anpara had matched Nanpara). That placed 476 of the 545 locations. The 69 that couldn’t be placed are mostly village monitoring sites in Punjab and small towns in Goa, Sikkim and Mizoram, and they are left off the maps rather than located by guesswork. A final check found 27 location-years counted twice because two place names matched the same location; these were removed before any of the calculations below.
What the decade looks like
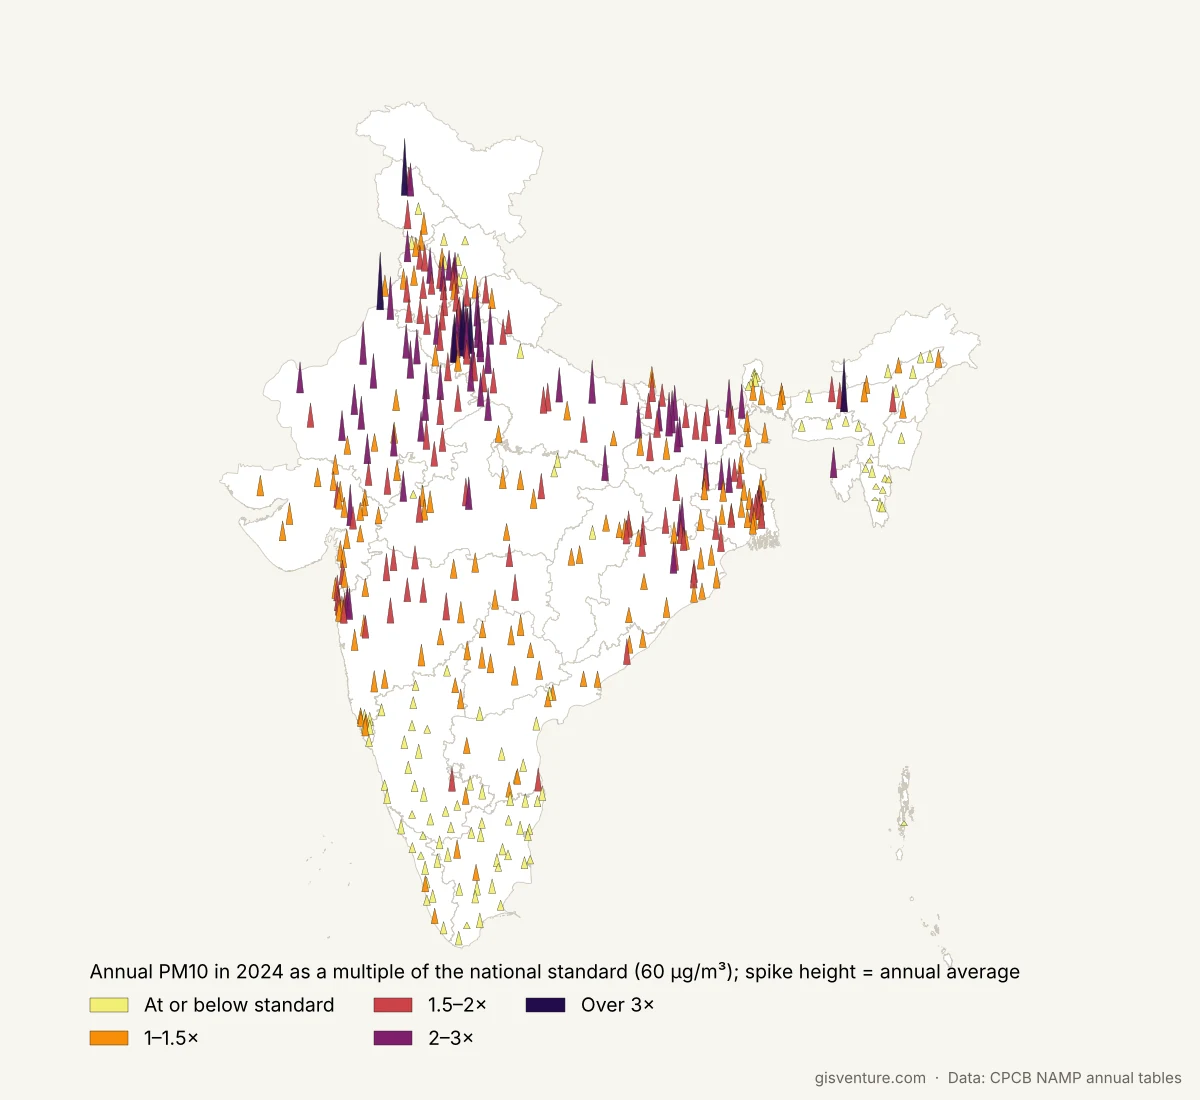
In 2024, 323 of the 433 mapped locations with PM10 data were above the annual standard of 60 µg/m³. PM2.5 is somewhat better but still poor: 171 of the 365 mapped locations with PM2.5 data exceeded its annual standard of 40 µg/m³. On the map the locations are drawn as spikes, with height showing the annual average and colour showing the multiple of the standard, and the tallest and darkest spikes run along the northern plains and around the mining and industrial towns of Jharkhand and Odisha.
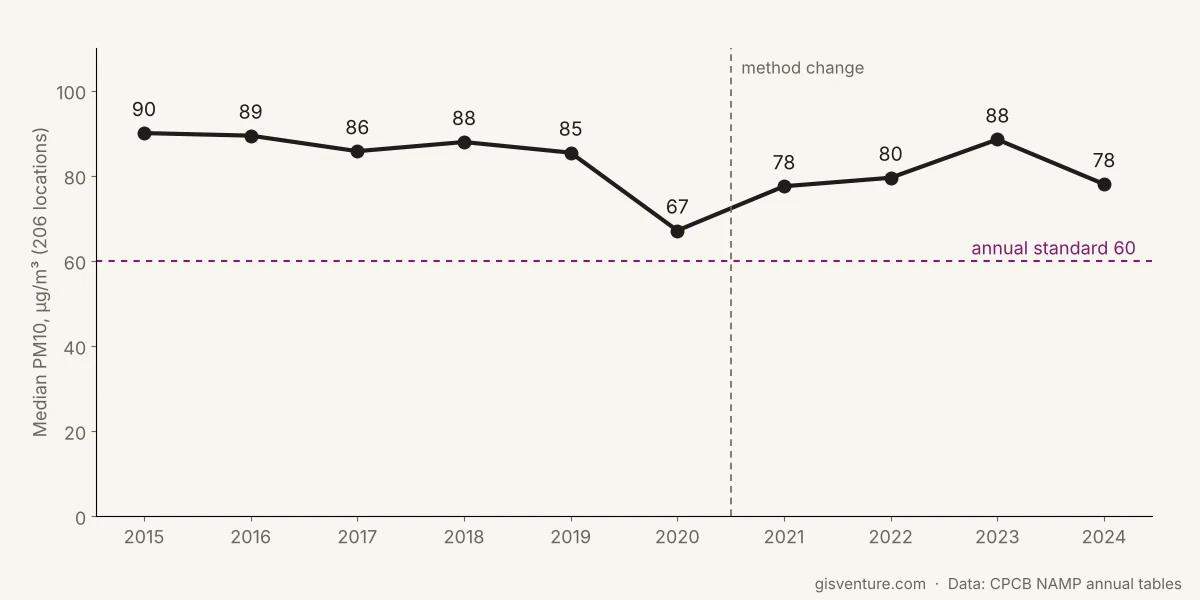
Checking whether things changed over the decade needed some care, because the monitoring network grew a lot. The number of locations with PM2.5 data jumped from 113 in 2020 to 263 in 2021 and reached 378 in 2024, which reflects new monitoring stations rather than new pollution. The comparison therefore uses only the 206 locations with PM10 data in at least 9 of the 10 years. Their median PM10 was 85 to 90 µg/m³ from 2015 to 2019, fell to 67 in 2020, and has been 78 to 88 since. That puts 2024 about 13% below 2015. The method also changed in 2021, from manual stations to CPCB’s integrated values, so a real improvement can’t be separated from the change in how location values are calculated. The 2020 dip coincides with the COVID-19 lockdown, which is the obvious explanation, but this data alone can’t show it was the cause.
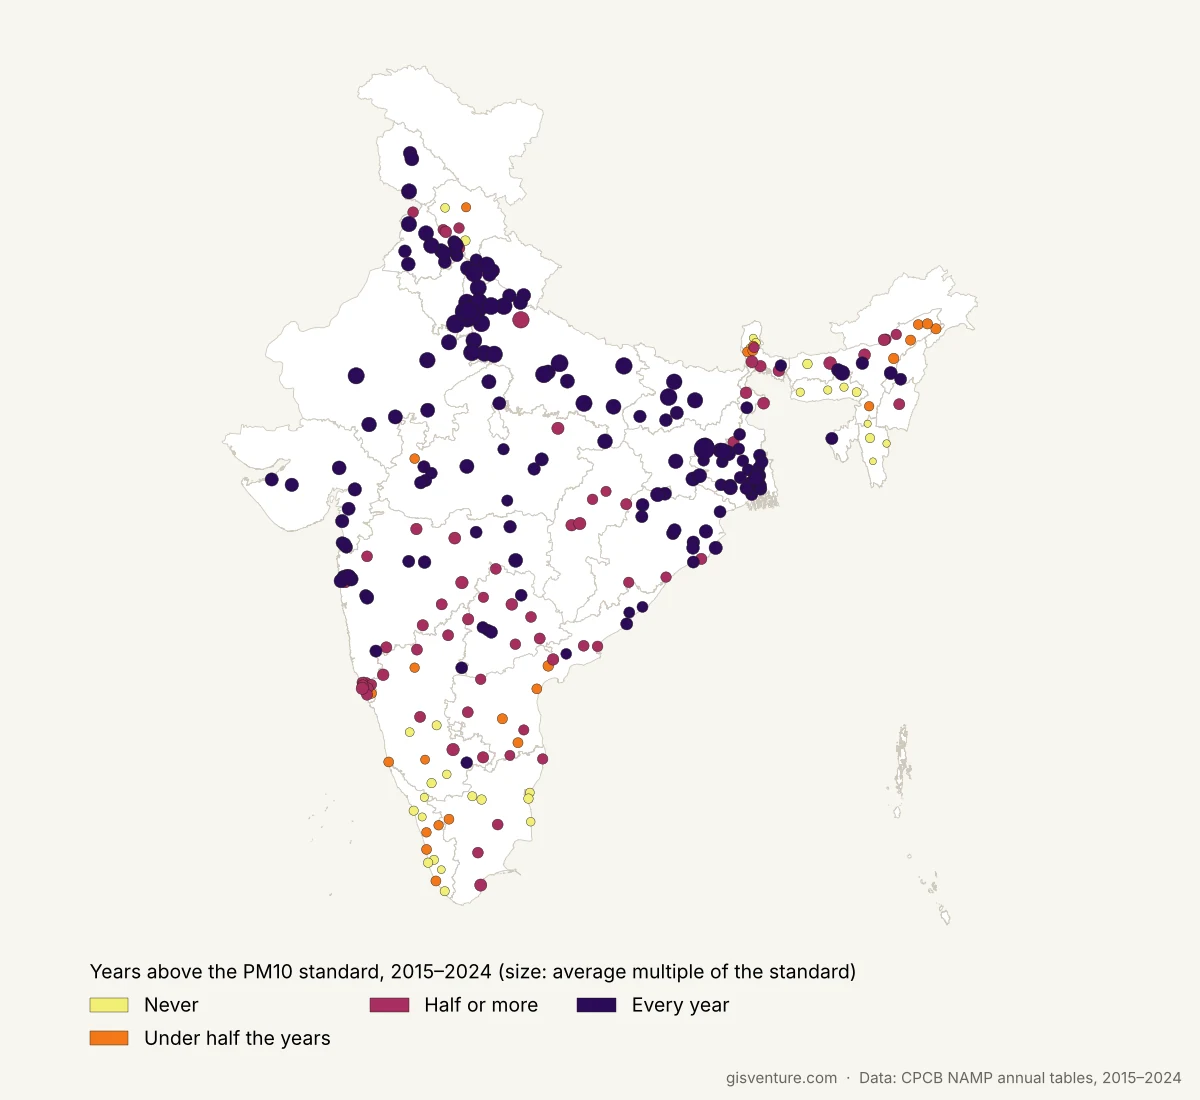
The persistence of the problem is clearer than the trend. Of the 247 locations with PM10 data in at least 8 of the 10 years, 130 were above the standard in every single year, and only 30 never were. Those 30 are hill towns and cities in Kerala, the Northeast, Sikkim and parts of Karnataka and Tamil Nadu. The highest ten-year averages were Jharia, a coal-mining area within Dhanbad (4.7 times the standard), Ghaziabad (3.7), Delhi (3.7), Bhiwadi (3.6) and Dhanbad (3.4). One might expect the northern plains to dominate the always-over list. They don’t: West Bengal (21 locations) and Uttar Pradesh (17) lead it, followed by Maharashtra (13), Odisha (11) and Madhya Pradesh (11).
Major cities
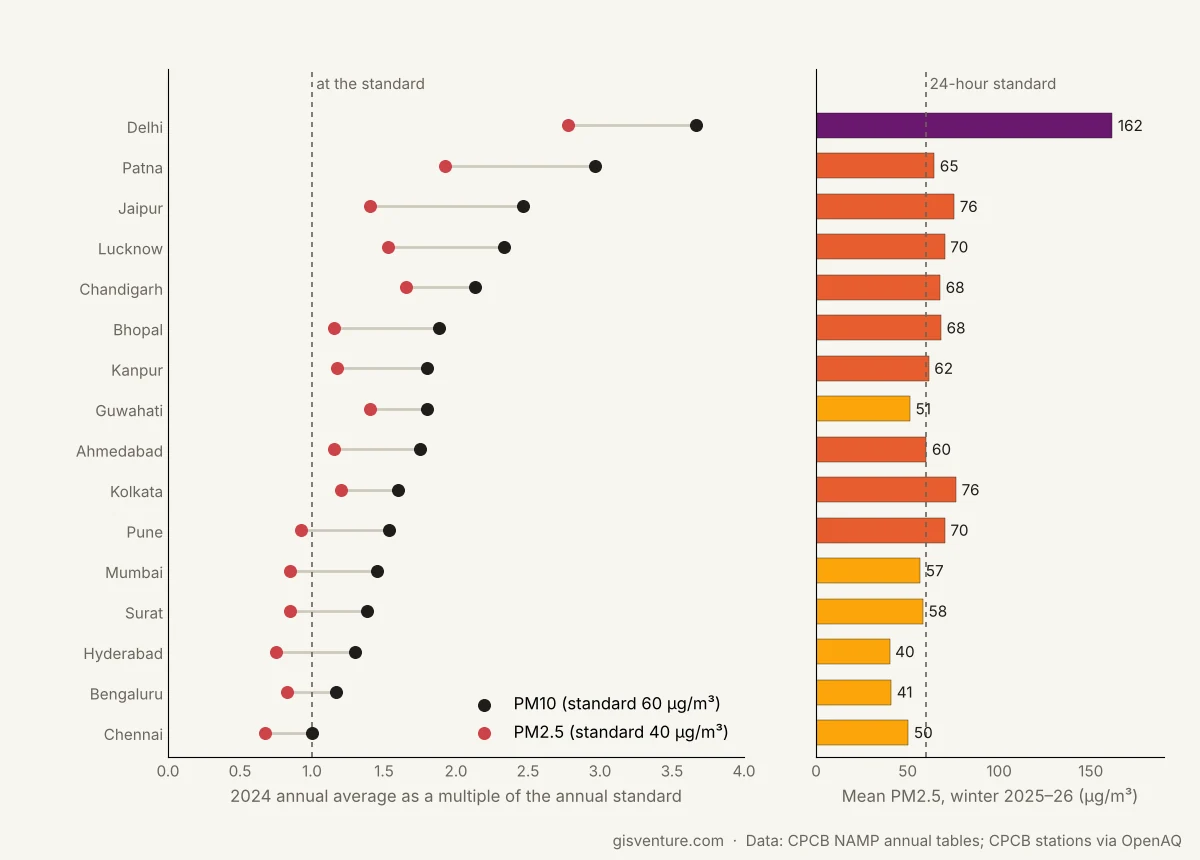
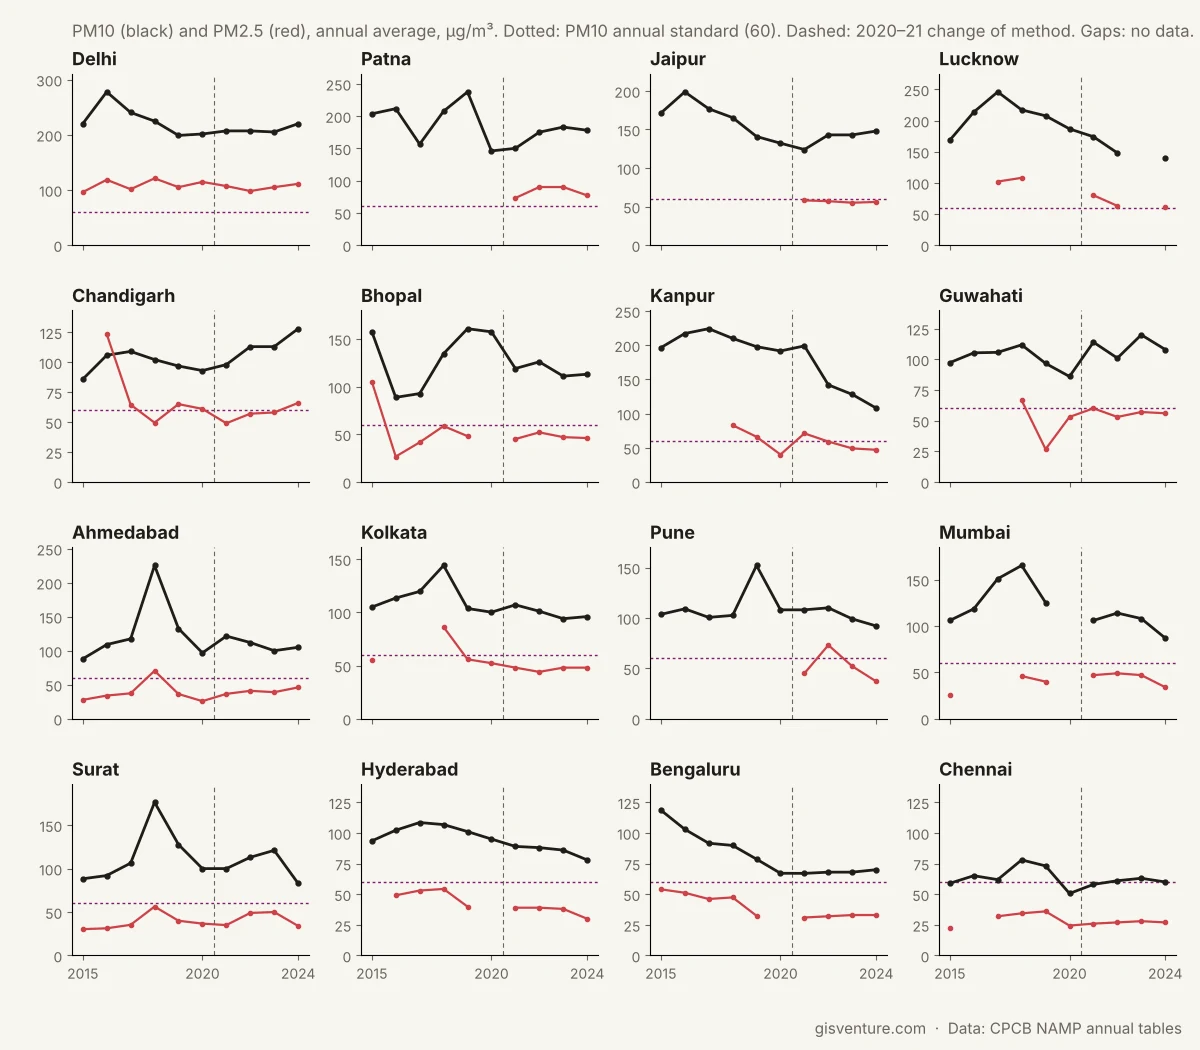
The national figures can hide differences between the largest cities, so the two figures below show 16 major cities on their own: the largest metropolitan areas and several state capitals with long monitoring records. In 2024 every one of them was at or above the annual PM10 standard, from Chennai at the standard to Delhi at 3.7 times it. For PM2.5 they divide more clearly: Hyderabad, Bengaluru, Chennai, Mumbai, Surat and Pune were below the annual standard of 40 µg/m³, while Delhi was close to three times it, and a similar division appears in winter 2025–26, when only Hyderabad, Bengaluru, Chennai and Guwahati stayed near or below 50 µg/m³. Values up to 2020 are means of each city’s manual monitoring stations and values from 2021 are CPCB’s integrated values, and several cities had only two or three stations in the earlier years, so the lines show each city’s record rather than a measure of improvement or deterioration.
States, only where coverage allows
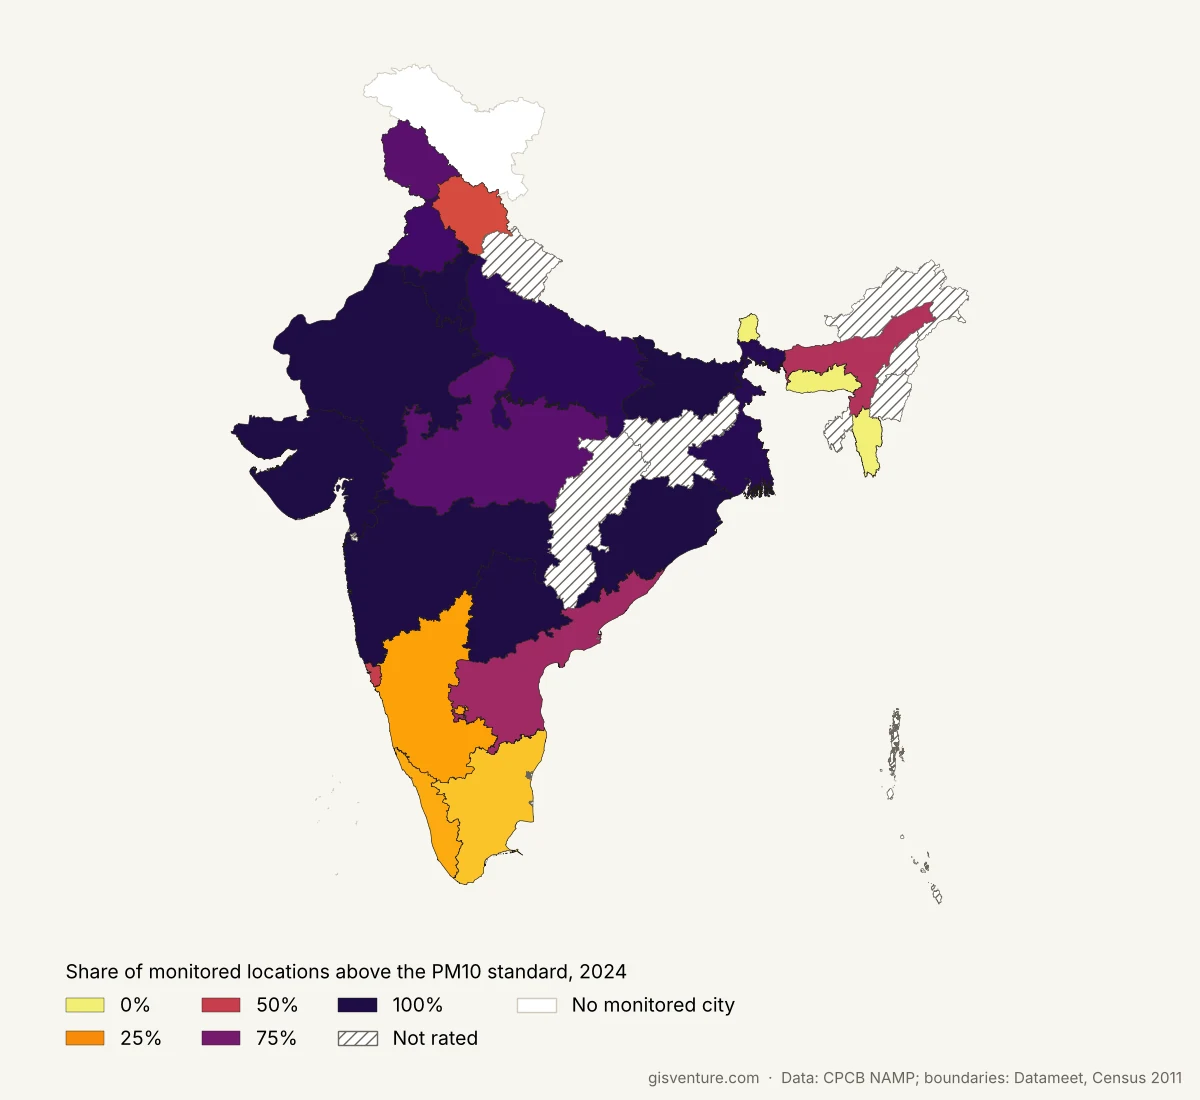
A state comparison is still useful, so the analysis rates a state by the share of its monitored locations above the standard, and only where those locations are spread widely enough to represent the state. Coverage is measured as the share of a state’s districts (Census 2011 boundaries) containing at least one monitored location, because a measure such as locations per square kilometre penalises large states and favours small ones. A state is rated if it has at least 3 monitored locations in at least 30% of its districts. Delhi and Chandigarh are single-city territories, so they are treated as fully covered, which also means their share can only be 0% or 100%.
In 2024, 24 states and territories qualified, and 9 of them had every monitored location above the PM10 standard. Uttar Pradesh only just qualifies at 31% coverage even with 26 monitored locations, because its monitoring stations are concentrated in the western part of the state, while Chhattisgarh (28%) and Jharkhand (8%) don’t qualify at all. The table below gives the full picture for 2024 PM10, with the number of continuous monitoring stations in each state in winter 2025–26 for comparison. Station counts for 2021 to 2024 aren’t available, because CPCB’s tables for those years give one value per location without the number of stations behind it. This rates the monitored locations of a state, not the whole state.
| State | Monitored locations, 2024 | Above PM10 standard | Share above | District coverage | Rated | Continuous stations, winter 2025–26 |
|---|---|---|---|---|---|---|
| Rajasthan | 34 | 34 | 100% | 100% | Yes | 46 |
| Maharashtra | 32 | 32 | 100% | 57% | Yes | 78 |
| Odisha | 25 | 25 | 100% | 53% | Yes | 17 |
| Bihar | 24 | 24 | 100% | 58% | Yes | 34 |
| Haryana | 22 | 22 | 100% | 90% | Yes | 27 |
| Gujarat | 20 | 20 | 100% | 58% | Yes | 15 |
| Telangana | 9 | 9 | 100% | 80% | Yes | 13 |
| Chandigarh | 1 | 1 | 100% | 100% | Yes (city territory) | 3 |
| Delhi | 1 | 1 | 100% | 100% | Yes (city territory) | 39 |
| West Bengal | 38 | 37 | 97% | 95% | Yes | 22 |
| Uttar Pradesh | 26 | 25 | 96% | 31% | Yes | 53 |
| Punjab | 20 | 18 | 90% | 75% | Yes | 8 |
| Madhya Pradesh | 18 | 15 | 83% | 32% | Yes | 24 |
| Jammu & Kashmir | 6 | 5 | 83% | 30% | Yes | 1 |
| Andhra Pradesh | 16 | 10 | 62% | 100% | Yes | 9 |
| Assam | 14 | 8 | 57% | 44% | Yes | 8 |
| Goa | 8 | 4 | 50% | 100% | Yes | 0 |
| Himachal Pradesh | 9 | 4 | 44% | 58% | Yes | 1 |
| Karnataka | 26 | 5 | 19% | 87% | Yes | 20 |
| Kerala | 12 | 2 | 17% | 79% | Yes | 5 |
| Tamil Nadu | 28 | 3 | 11% | 78% | Yes | 14 |
| Mizoram | 10 | 0 | 0% | 100% | Yes | 0 |
| Sikkim | 5 | 0 | 0% | 100% | Yes | 1 |
| Meghalaya | 4 | 0 | 0% | 57% | Yes | 2 |
| Jharkhand | 4 | 4 | 100% | 8% | No | 1 |
| Uttarakhand | 3 | 3 | 100% | 15% | No | 3 |
| Nagaland | 2 | 2 | 100% | 18% | No | 1 |
| Dadra and Nagar Haveli and Daman and Diu | 1 | 1 | 100% | 33% | No | 0 |
| Tripura | 1 | 1 | 100% | 25% | No | 1 |
| Chhattisgarh | 9 | 8 | 89% | 28% | No | 14 |
| Puducherry | 2 | 0 | 0% | 50% | No | 1 |
| Andaman & Nicobar | 1 | 0 | 0% | 33% | No | 0 |
| Arunachal Pradesh | 1 | 0 | 0% | 6% | No | 1 |
| Manipur | 1 | 0 | 0% | 11% | No | 0 |
Winter 2025–26, week by week
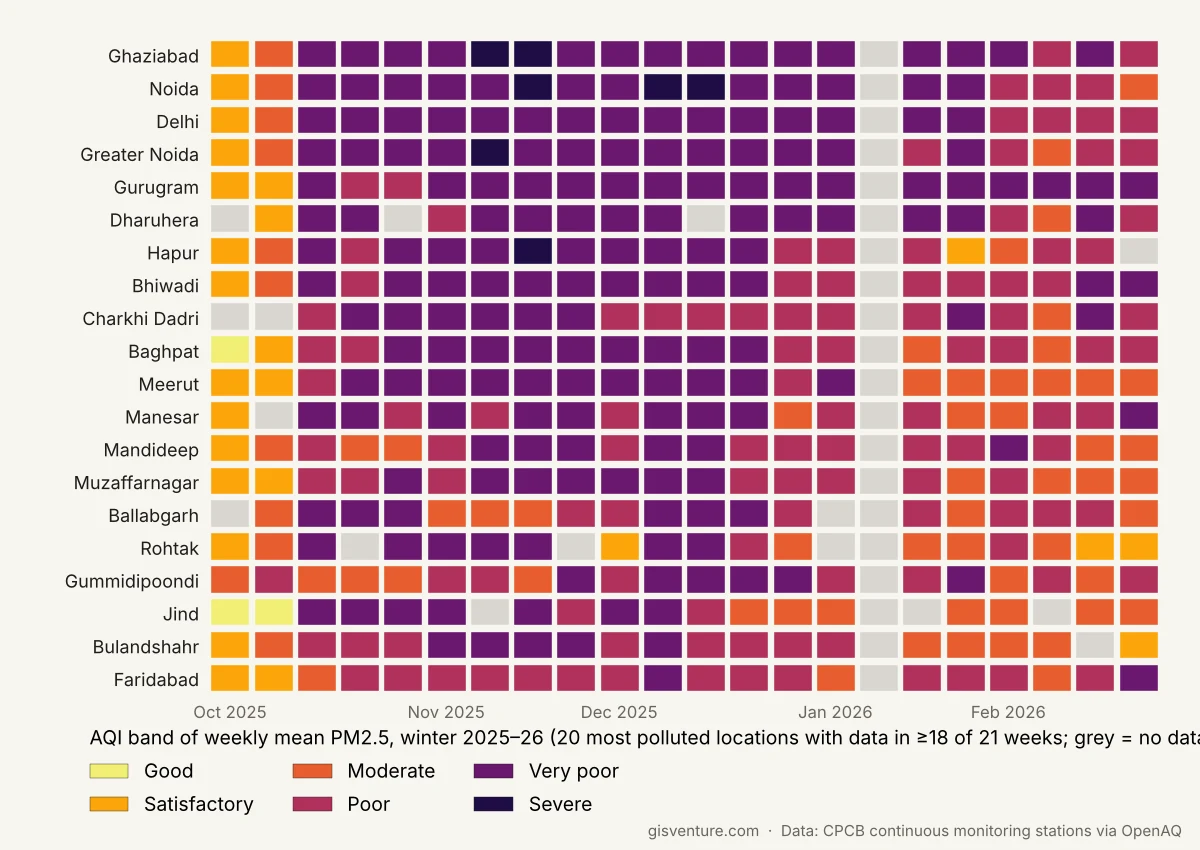
The annual tables hide the season, and in north India the season is most of the story, so winter 2025–26 was analysed at weekly resolution. Daily PM2.5 from CPCB’s continuous monitoring stations was used, dropping days with less than 67% of hours reported and removing 77 daily values stuck at 985 µg/m³. That value is a sensor ceiling, not a measurement, and before its removal Hassan and Tirunelveli appeared as the most polluted locations in India. A station counts only if it has valid data on at least half the days of the season, which left 462 stations, and a weekly value needs at least 4 valid days. A location’s weekly value is the mean of its stations. The weeks are coloured with CPCB’s AQI bands for PM2.5, but a weekly mean is not an official AQI, so the colours serve only as a guide.
As a check on the method, the winter averages were compared with CREA’s published winter snapshot, which uses the same CPCB station data with a stricter 80% coverage rule. The values here were Ghaziabad 167, Noida 166 and Delhi 162 µg/m³, against CREA’s 172, 166 and 163 (CREA, March 2026), close enough to suggest the processing here adds little error of its own.
The worst stretch ran from November into January, and the most polluted locations were almost all in the Delhi region: Ghaziabad, Noida, Delhi, Greater Noida and Gurugram top the list. Delhi’s worst week began on 12 November 2025 and averaged 248 µg/m³, roughly four times the 24-hour standard of 60 (which strictly applies to daily values, not weekly ones). There are no readings at all for 11 to 20 January 2026, so that week is missing from every city.
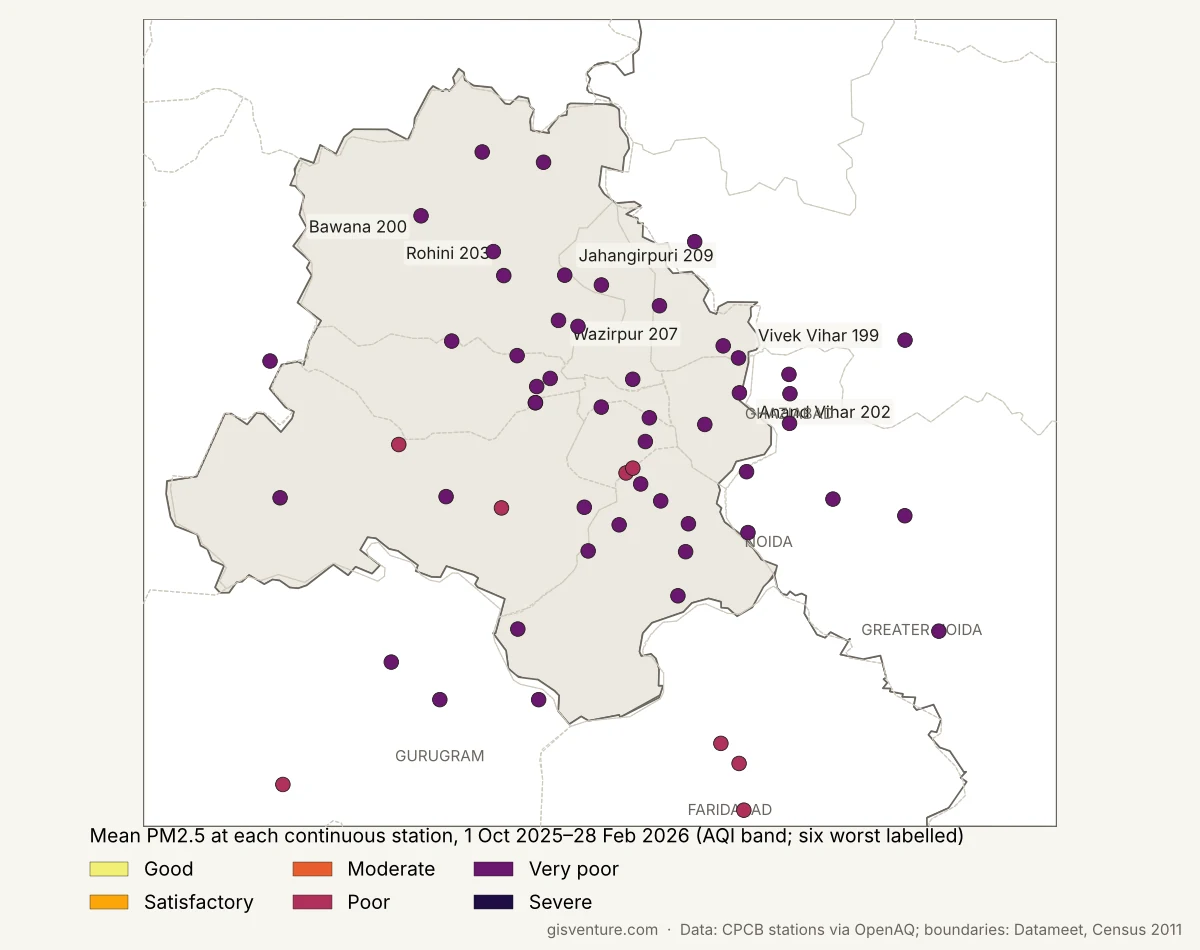
Within Delhi-NCR the differences between stations are large. Of the 57 stations in the region, the worst over the winter were all in Delhi: Jahangirpuri (209 µg/m³), Wazirpur (207), Rohini (203), Anand Vihar (202), Bawana (200) and Vivek Vihar (199). Even the cleanest, New Industrial Town in Faridabad at 92 µg/m³, was above 60 on every valid day, and in Delhi itself the cleanest were IGI Airport (115) and Lodhi Road (117).
Winter 2026–27 so far (to 11 November)
Winter 2026–27 has data only up to 11 November 2026, about six weeks, so it is compared with exactly the same six weeks of 2025 rather than with the whole of winter 2025–26. To keep the comparison fair, only stations that reported in both years are used, which gives 229 locations. Nationally there is essentially no change: the median change across locations was a 0.6% fall, and 48.5% of locations were higher than in 2025. In the latest week with data, starting 5 November 2026, 59.5% of locations were above the 24-hour PM2.5 standard.
The NCR locations read lower than in 2025, with Delhi down 13%, Ghaziabad 23%, Noida 19% and Gurugram 18%, while some locations elsewhere went the other way (Ahmedabad was up 15%). It is too early to read anything into this. Six weeks is a short window, weather alone could plausibly shift these numbers by that much, and the worst weeks of winter 2025–26 came later in the season.
What this is, and what it isn’t
This is an exploratory look at public monitoring data, not research, and a few limits matter for how far the results can be taken.
- The method changes in 2021. Up to 2020 a location’s value is the mean of its manual stations; from 2021 it is CPCB’s integrated value. Any change across that line is partly the network, not the air, which is why no decade-long improvement is claimed here.
- Coverage is uneven. Monitoring stations are concentrated in urban areas, many states have only a few of them, and 69 small towns and village sites couldn’t be placed on the map. The state view only rates monitored locations, and only where they cover at least 30% of districts.
- Annual averages and weekly means are not AQI. The decade view shows multiples of the annual standard, and the weekly colours borrow AQI bands as a guide.
- Winter 2026–27 is covered for only six weeks. That is too short to call a trend in either direction.
- Data gaps. There are no readings at all for 11 to 20 January 2026 and 24 to 26 October 2026, and some stations report only part of the season.
Turning this into something defensible would need a consistent station-level series across the whole decade, station siting information (kerbside, industrial or background), a way to fill the space between monitored locations, such as satellite-derived PM2.5, and a proper check of how much weather explains the year-to-year differences.
Data downloads
The cleaned data behind every map and number here is available to download:
- Annual averages by location, 2015 to 2024: one row per location per year, with state, coordinates, how each location was placed, the method used that year, and station counts up to 2020.
- States by share of locations above the standard: per state and period, with district coverage and whether the state is rated.
- Weekly PM2.5 by location, two winters: one row per location per week, with the number of stations.
- Station winter means, 2025 to 2026: one row per continuous monitoring station, with valid days and days above 60 µg/m³.
Method
- Data
- CPCB National Air Quality Monitoring Programme annual tables, 2015 to 2024; CPCB continuous ambient air quality monitoring stations, accessed through OpenAQ, to 11 November 2026; state boundaries from Datameet following India’s official boundary; district boundaries from Census 2011; location positions from OpenAQ, a GeoNames-derived place list and Natural Earth
- Processing
- PDF tables extracted cell by cell; station rows assigned to locations from cell geometry; place names harmonised (545 locations, 476 placed on the map); 2015–2020 location value = mean of manual stations, from 2021 CPCB’s integrated value. Winter PM2.5: days under 67% hourly coverage dropped, 985 µg/m³ ceiling values removed, stations kept with valid data on at least half the season’s days, weekly values need at least 4 valid days
- Checks
- Annual mean within each row’s own minimum and maximum (9 rows failed and were excluded); fuzzy place matches checked by hand; duplicate location-years removed; winter averages compared with CREA’s winter 2025–26 snapshot. No correction for weather, and no consistent station-level series across the 2021 method change
- Credits
- The data extraction, processing, maps and initial draft of this write-up were produced with Claude AI (Claude Opus 5.5), working from the author’s questions and decisions, and reviewed by the author.
- Code
- Available on request.
A question for readers
If you know of station siting information for CPCB stations, or have worked with this data in another way, I would like to hear about it.